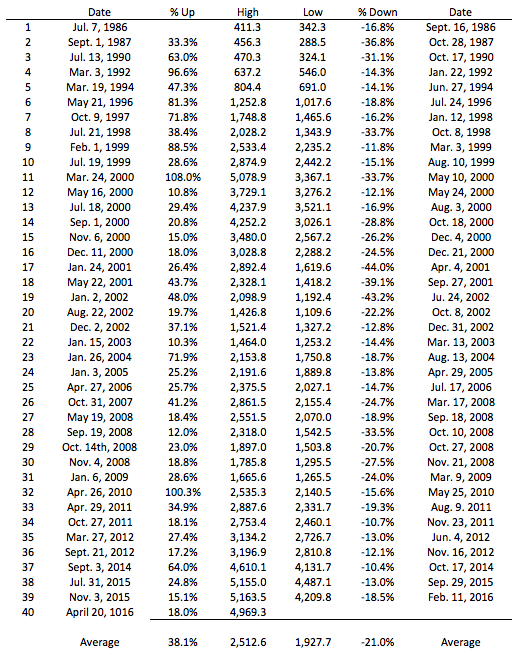
Public equity markets go up and down……a lot. Per the chart below, the NASDAQ has gone up or down 10 percent a total of 78 times over the last 30 years (after having previously gone up or down at least 10 percent). That’s 2.6 times per year, or once every 4.6 months:

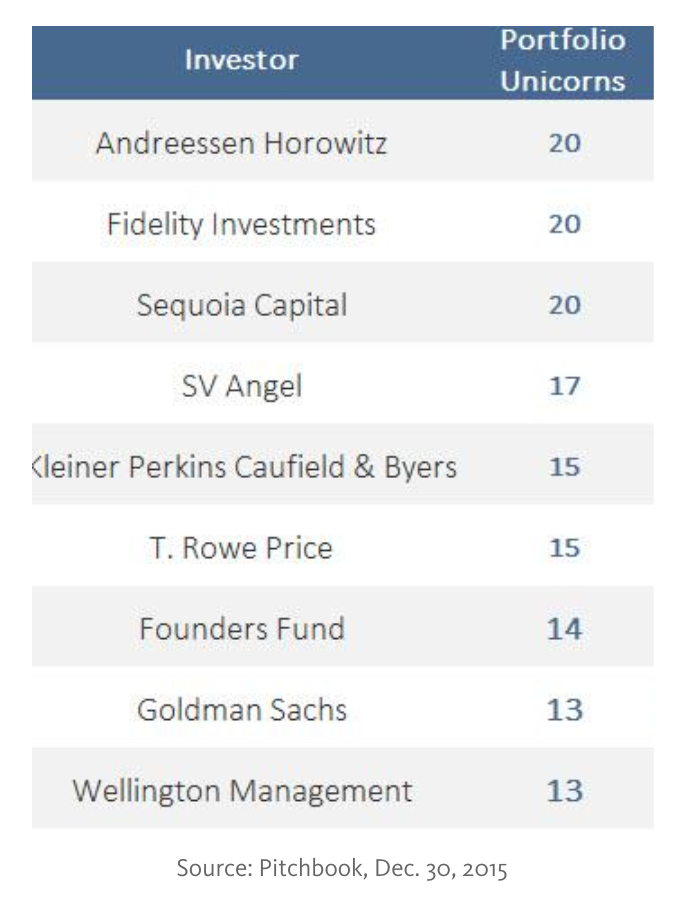
Like their public brethren, private company valuations also go up and down. In 2015, the private markets were on a tear (at least for the first three quarters). In fact, many called 2015 “The Year of the Unicorn”, with 75 new unicorns created globally. 3 of the top 9 holders of unicorns were publicly traded mutual funds Fidelity, T.Rowe, and Wellington:
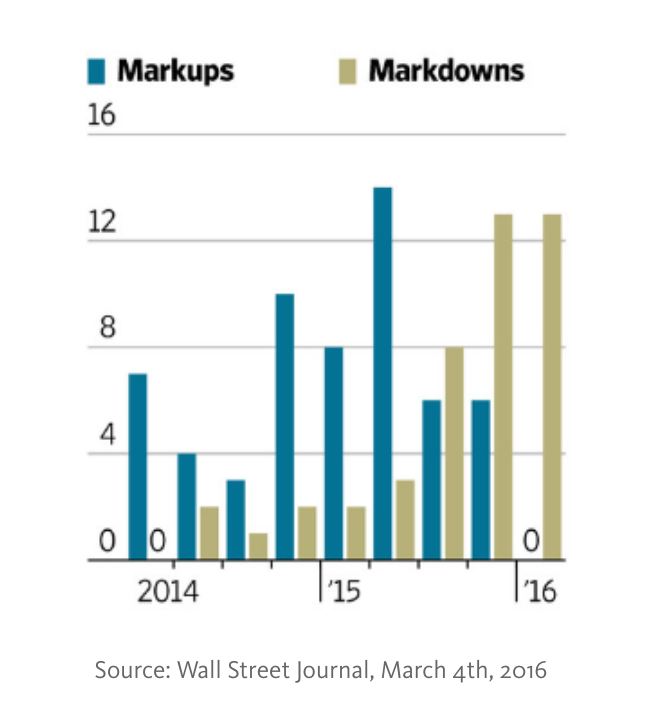
Many private company CEOs saw it as a badge 0f honor to have a mutual fund on the cap table. Pure Storage CEO, Scott Dietzen said he chose Fidelity and T. Rowe to invest in their private rounds before they IPO’d because he “… felt their oversight would help us become a better public company. It was a great litmus test for the business to have some of the biggest and best public market investors in the world involved.” Well that litmus test is now being put to the test, as these same mutual funds that were excited about investing in private companies put the brakes on new unicorn investments as they marked down existing investments. The chart below shows the quarterly number of mutual fund markups and markdowns of at least 5 percent of private company portfolio companies worth at least $1B:
Now the same publications that were extolling 2015 as “The Age of Unicorns” are declaring 2016 the year of “Unicorn Stink”. Last year, mutual fund markdowns of unicorns started to become newsworthy. It started in November with word that Fidelity had cut its value of Snapchat by 25 percent. This was closely followed by stories about a slew of other Fidelity markdowns. And the stories of markdowns continue on a regular basis with stories like “Fidelity Marks Down Startups Including Dropbox, Zenefits” or “T. Rowe Price Marks Down Dropbox to New Low” having been written in the last month. The Wall Street Journal has even started a “Start Up Tracker” so readers can track the latest markups or markdowns of their favorite private companies.
I get why markdowns make for good press. Not the least of which is schadenfreude. And stories like “Why Mutual Funds Can’t Agree on What Unicorns Are Worth” have written about how private market valuations are part art, part science. But even I was surprised by my quick analysis of the 23 startups in the WSJ Tracker that had at least two different mutual fund holders. On average, across the 23 startups, the highest valuation is 34.6 percent above the lowest valuation.The median difference is 17.9 percent. Below is a list of the Top 10 biggest price differences (only the mutual funds with the highest price and the mutual fund with the lowest price for each company are shown):

A few things stand out from this Top 10 list. First, 7 of the highest prices are from earlier time periods than the lowest prices, while 2 (Palantir and Nutanix) are from the same period, and 1 (AirBnB) has the highest price from a later period than the lower price. Second, BlackRock has 4 of the 10 highest prices and none of the lowest (although all of BlackRock highest prices are from earlier periods). T. Rowe has 3 of the lowest prices and none of the highest. But the biggest standout, is just the sheer size of the differences between the valuations. The average difference in the Top 10 is 93 percent! Even taking out MongoDB and its outsized 222 percent differential, the average difference is still 79 percent. This just highlights the randomness of the valuation process, which should negate the press’s interest. I get why the press writes about the markdowns, and will continue to. I’ll just be less interested.
Image credit: CC by Gisela Giardino